plannr is an in-development package used for parsing Microsoft Planner data into R via exported Excel spreadsheets for easy usage and creation of beautiful ggplot2 or plotly visuals.
Usage of plannr is fairly simple:
- Open your planner in the Microsoft Planner web application.
- Export plan to Excel (as
.xlsx). - Read using plannr’s
read_planner()function.
Now you have your Planner data imported into R as a plannr object!
Plotting with plannr
Using the plot_planner() function, you can quickly create a donut chart using ggplot or plotly to your specifications. plot_planner() supports filtering by:
-
tasks- Tasks (w/o Checklists) -
checklists- Tasks (w/ Checklists) -
priority- Priority -
late- Late Tasks -
assigned_to- Assigned To -
completed_by- Completed By
Examples:
Plannr Object Summary
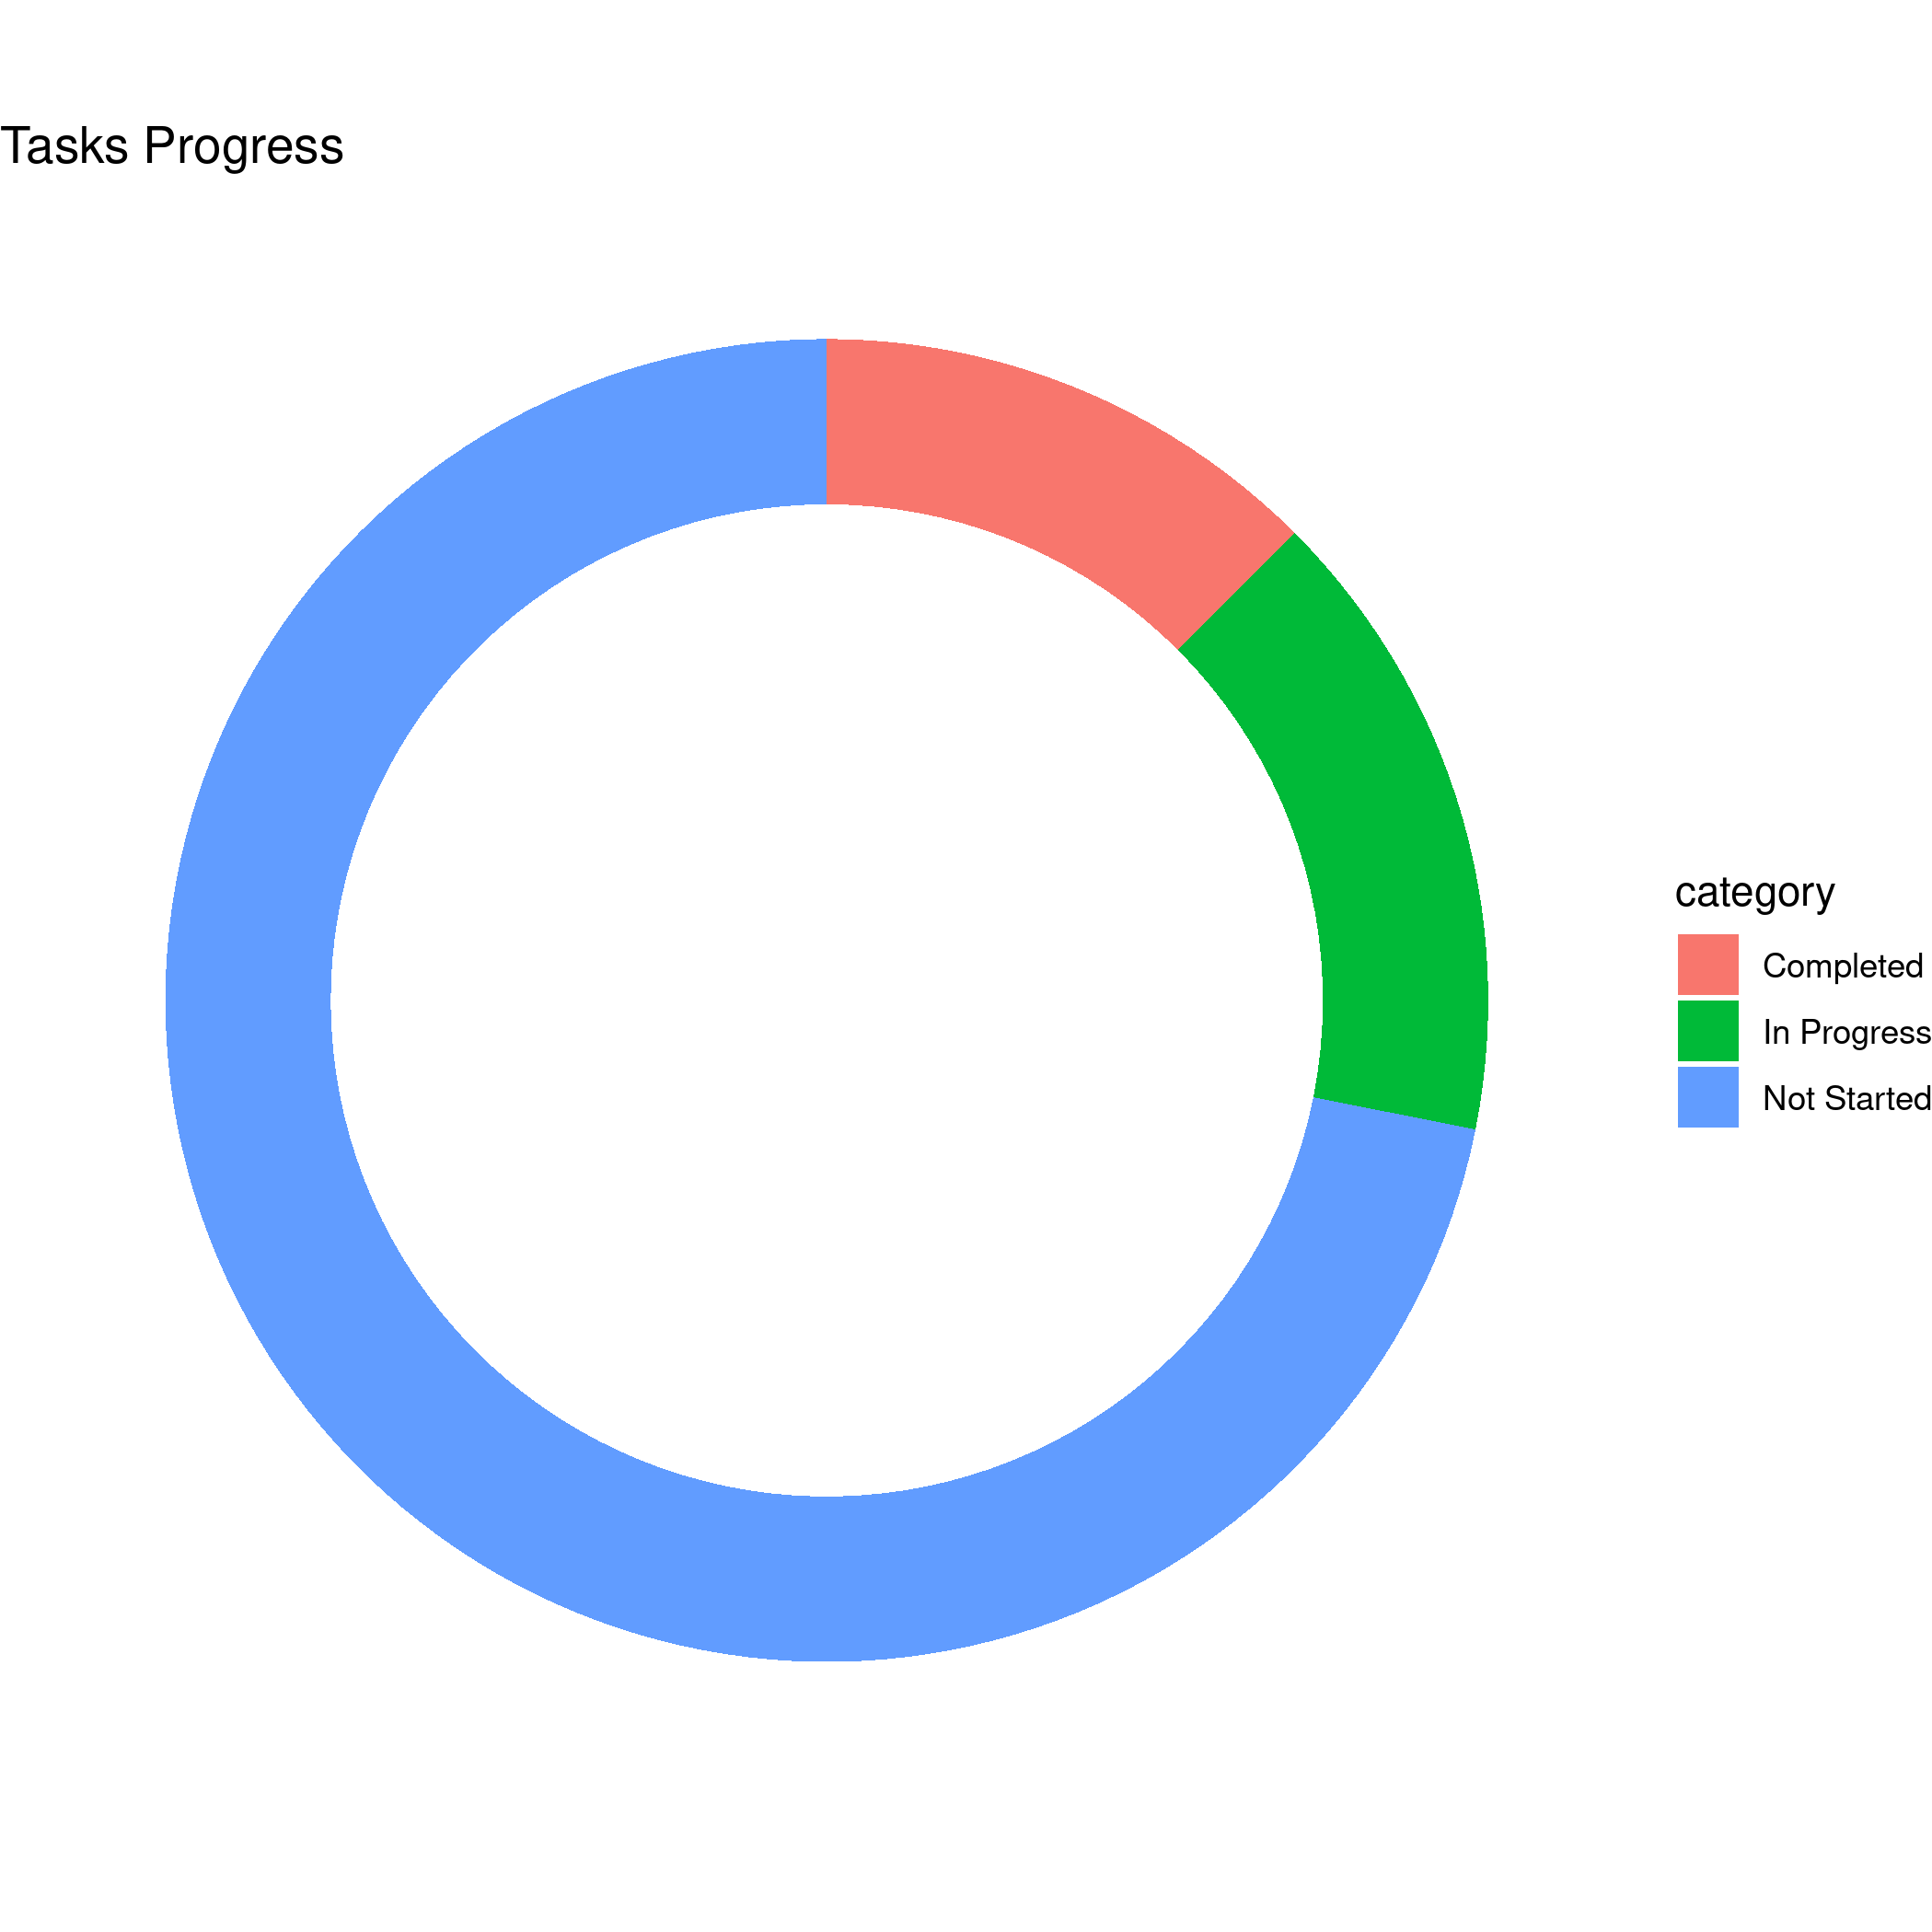
plan_xlsx <- read_planner("path/to/planner.xlsx")

summary(plan_xlsx)

# Return:
# =======>> PLANNER <<=======
#    Plan Name: Example Plan
#  Export Date: 01/01/1234
# ========>> TASKS <<========
#       Total: 32 Tasks
#   Completed: 4    (12.50%)
# In Progress: 5    (15.62%)
# Not Started: 23   (71.88%)
# ===>> CHECKLIST TASKS <<===
#       Total: 57 Tasks
#   Completed: 0    (0.00%)
# Not Started: 57   (100.00%)
# ===========================
Basic Plotting
# Print a donut plot taking into account checklists on tasks
plan_xlsx <- read_planner("path/to/planner.xlsx")

plot_planner(plan_xlsx, by = "checklists")
Getting filtered plot data
# Return a easy-plottable-tibble of the planner data filtered by priority
plot_planner(plan_xlsx, by = "priority", data_only = TRUE)
Extending with ggplot
# Easy customizability via `plot_type = "basic"` argument.
# Which, returns a ggplot() object of the planner data without
# anything additional.
#
# labs() parameters can be added to the end of the argument list
# for plot_planner() calls.
plot_planner(
    plan_xlsx,
    by = "tasks",
    plot_type = "basic",
    title = "Tasks Progress"
) +
geom_bar() +
theme_bw() +
theme(
    legend.position = "none"
)
Interactive plots with plotly
plot_planner(
    plan_xlsx,
    by = "checklists",
    interactive = TRUE
)
Using dplyr with Planner data
Currently there’s two supported ways of using dplyr functions via plannr.
- Using
filter_planner()fordplyr::filter(). - Using
plot_planner(..., data_only = TRUE, ...)withmagrittrpiping.
Documentation
You can view the documentation here: https://plannr.justinsingh.me.

